Member-only story
How to Debug a 502 on Kubernetes
Here is a thorough method to check the readiness of your application in order to determine the cause of your 502 problem
You did it — you’ve built a Docker image, created a Cluster, set up a Deployment, structured a Service, and configured an Ingress alongside an automated TLS certificate issuer!
Your app is ready to go!
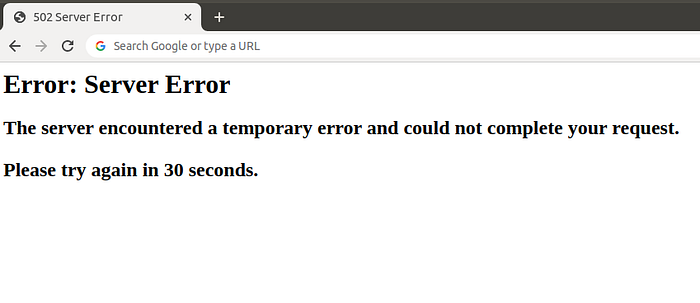
As you load the domain in your browser and prepare to see your completed work, you are instead greeted with an ugly and awful error page reading:
502 Server Error
Error: Server Error
The server encountered a temporary error and could not complete your request. Please try again in 30 seconds.
Here is a picture:

Aside from deep-level debugging on the app layer, its often beneficial to first determine the overall healthiness of your application’s setup, starting from the pod, then container, then service, then ingress, and finishing with application-level debug logs. At the end of the article is a list of common debugging steps to try out if you don’t want to run through a full end-to-end health check.
While this guide was completed using Google Cloud Platform (GCP) and Google Kubernetes Engine (GKE), all of these steps will still apply for any platform that is running a recent version of Kubernetes.
Is your pod running?
Sometimes it's just this simple — perhaps your pod failed to startup properly, or one of the containers inside the pod is stuck in an invalid state.
$ kubectl get pods
NAME READY STATUS RESTARTS AGE
my-pod-6c966b5bc7-6bcjf 3/3 Running 0 2d20h
Are your pod containers healthy?
If your pod is healthy-looking at a basic level, next you should describe the pod and ensure that the necessary ports are open and listening, by describing the pod (using the name from the previous step). Ensure that…
